Learn how small business inventory management affects your margins, COGS, and cash flow. Includes reorder point formulas and a real retail example.
Small Business Inventory Management: A Practical Guide for Product Sellers
Poor inventory management is one of the most expensive mistakes a product-based business can make, and most owners never see it coming. Miscounted stock, missed reorders, and sloppy cost tracking quietly drain margins while revenue looks fine on the surface. This guide breaks down small business inventory management in practical terms, covering COGS, reorder points, and exactly how to fix the leaks before they sink you.
Key Takeaways
- Inventory errors directly inflate your Cost of Goods Sold (COGS), which can shrink gross margins by 5% to 15% without any change in sales volume.
- The average small retailer carries 20% to 30% more inventory than necessary, tying up cash that could fund growth or cover operating expenses.
- A reorder point formula prevents stockouts and overstocking by triggering purchases at the right time based on lead time and daily sales rate.
- Businesses that reconcile physical inventory monthly catch shrinkage and miscounts before they compound into year-end tax and reporting problems.
- According to the National Retail Federation, inventory shrinkage costs U.S. retailers approximately $112 billion per year, with small businesses disproportionately affected due to limited oversight systems.
Why Inventory Management Determines Your Actual Profit
Most product sellers focus on revenue. The real story is in inventory.
Your gross profit depends entirely on how accurately you track what you paid for the goods you sold. If that number is off, every margin calculation downstream is wrong. You might believe you are running a 45% gross margin business when the real number is closer to 32%.
The gap between perceived and actual profitability is almost always tied to one of three issues: inaccurate COGS tracking, inconsistent inventory counts, or poor reorder timing. Each one compounds the others.
Understanding COGS and Why It Starts with Inventory
What COGS Actually Measures
Cost of Goods Sold is the direct cost of the products you sold during a given period. For a product-based business, the formula is straightforward.
COGS = Beginning Inventory + Purchases During the Period, Minus Ending Inventory
The number you land on directly reduces your gross profit. If your beginning inventory is off because of a miscount or unrecorded shrinkage, your COGS becomes unreliable, and so does every financial decision you make from that point forward.
How Inventory Errors Inflate COGS
Here is why that matters in practice. If you overstate your ending inventory, your COGS appears lower, and your gross profit looks higher than it actually is. If you understate ending inventory, the opposite happens. Either way, you are making pricing, purchasing, and tax decisions based on fiction.
A common source of error is shrinkage: theft, damage, miscounts, or supplier short-ships that never get recorded. A small retail shop losing 3% of inventory value to unrecorded shrinkage on $200,000 in annual product costs is quietly losing $6,000 per year in phantom COGS. That wipes out the profit on hundreds of transactions.
Choosing the Right Inventory Costing Method
The method you use to assign costs to sold inventory changes your COGS, even when the physical products are identical.
FIFO (First In, First Out) assumes the oldest inventory sells first. During inflation, FIFO produces a lower COGS and higher reported profit, which means higher taxes.
LIFO (Last In, First Out) assumes the newest inventory sells first. This raises COGS during inflationary periods and reduces taxable income. Note that LIFO is not permitted under international accounting standards (IFRS) and is only available to U.S. companies under GAAP.
Weighted Average Cost smooths costs across all units. It is simpler to apply and works well for businesses with high transaction volumes and similar products.
Most small retailers use FIFO or weighted average. The key is consistency. Switching methods midstream distorts financial comparisons and can trigger IRS scrutiny.
Real Example: How Margin Leaks Happen
Meet Sycamore Home Goods
Sycamore Home Goods is a small brick-and-mortar retail shop in Asheville, North Carolina, selling candles, textiles, and home accessories. Owner Dana Marsh had been running the store for three years with steady revenue around $320,000 annually. Her QuickBooks dashboard showed a 41% gross margin. Her bank account told a different story.
When Dana hired a bookkeeper to do a mid-year inventory reconciliation, the results were eye-opening. Her actual physical inventory count came in at $18,400 less than her accounting records showed. Over 18 months, she had absorbed $6,200 in supplier short-ships without adjusting her records, lost roughly $4,800 to unrecorded damage markdowns, and had $7,400 in slow-moving inventory that had never been written down.
Her real gross margin was 34.6%, not 41%. That 6.4 percentage point gap meant she had been underpricing custom orders, under-budgeting for buying trips, and overestimating how much she could pay herself.
The fix was not complicated. Dana implemented a monthly cycle count (counting one product category per week instead of a full annual count), started recording every damaged or returned item the same day it happened, and set a formal reorder system for her top 30 SKUs. Within two quarters, her records and her bank account matched.
Small Business Inventory Management: Reorder Points and Avoiding Stockouts
Why Reorder Timing is a Financial Decision
Running out of a product is not just an inconvenience. It is a direct revenue loss and a customer retention problem. Ordering too early ties up cash and creates storage costs. The reorder point formula gives you a specific trigger to act on instead of guessing.
The Reorder Point Formula
Reorder Point = (Average Daily Sales x Lead Time in Days) + Safety Stock
Here is how that works with real numbers. Suppose you sell 15 units of a product per day on average. Your supplier takes 8 days to deliver. You want to keep a 3-day buffer (safety stock) in case of delays.
Reorder Point = (15 x 8) + (15 x 3) = 120 + 45 = 165 units
When your stock drops to 165 units, you place a new order. This approach means you will not run out before the next shipment arrives, even if the delivery is slightly delayed.
Calculating Safety Stock
Safety stock is the cushion between normal operations and disruption. A simple formula for safety stock is:
Safety Stock = (Maximum Daily Sales, Minus Average Daily Sales) x Maximum Lead Time
If your maximum daily sales spike to 22 units and your maximum lead time stretches to 11 days, your safety stock would be (22 - 15) x 11 = 77 units.
This is not excess inventory. It is calculated protection against the scenarios that kill customer satisfaction and repeat business.
How to Set Up a Basic Inventory Management System
Start with a SKU-Level Inventory Count
Before any system works, you need an accurate starting point. Count every product by SKU, record the quantity and unit cost, and document the date. This becomes your baseline.
If a full count is not practical, prioritize your top 20% of SKUs by revenue contribution. In most small retail businesses, that top 20% accounts for 70% to 80% of sales volume.
Track Every Movement In and Out
Every purchase order, every sale, every return, every damaged item, and every promotional giveaway changes your inventory count. The businesses that lose control of COGS are almost always the ones that only record purchases and sales, skipping the adjustments in between.
A simple spreadsheet tracking inflows, outflows, and adjustments with a running balance per SKU is enough to start. You do not need expensive software in year one.
Reconcile Monthly, Not Annually
Annual inventory counts find problems once a year. Monthly cycle counts catch errors before they compound. Counting one category per week takes 30 to 60 minutes and gives you rolling visibility into shrinkage, supplier discrepancies, and slow movers.
Monthly reconciliation also makes tax season far less painful. When your books reflect accurate inventory all year, your year-end COGS calculation is a formality rather than a scramble.
Tools That Save Time on Inventory Tracking
Spreadsheets work until the volume of SKUs and transactions makes manual tracking unreliable. Point-of-sale systems like Square, Lightspeed, and Shopify include inventory tracking that updates automatically with each sale. These platforms typically cost between $29 and $299 per month depending on features.
For businesses not yet ready to invest in a full POS upgrade, a structured spreadsheet template built specifically for inventory and sales tracking closes most of the gap at a fraction of the cost.
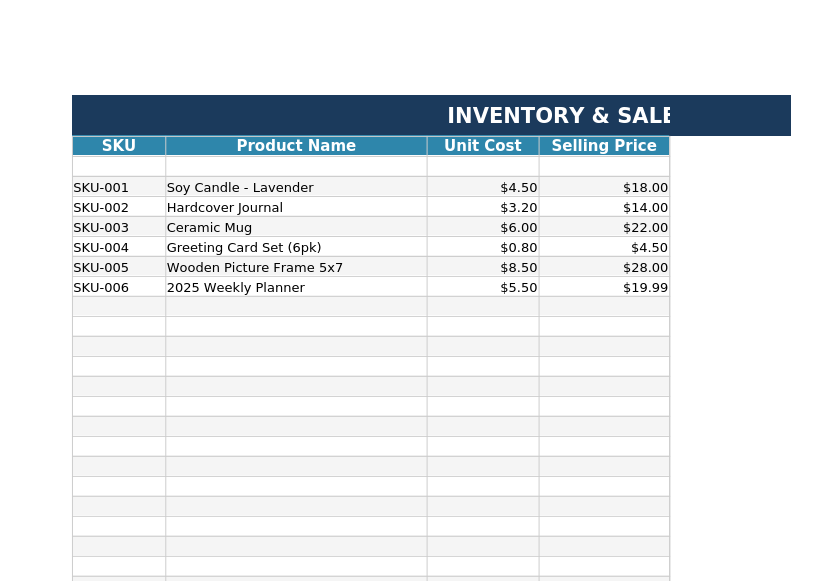
If you want to apply everything covered in this guide without building a tracking system from scratch, the Inventory and Sales Tracker template at smallbizfinancehq.com/templates was built for exactly this purpose. It includes pre-built formulas for COGS, reorder point calculations, and a monthly reconciliation tab. For $15, it replaces hours of manual setup and gives you the same structure Dana used to get Sycamore Home Goods back on track. It is a practical starting point, not a software replacement.
What the Template Looks Like
Here is a preview of the Inventory & Sales Tracker with sample data filled in:
The Bottom Line
Inventory management is not a back-office detail. It is the foundation of accurate COGS, reliable margins, and informed pricing decisions. Small errors in counting, costing, or reorder timing compound quietly over months and years, showing up as cash shortfalls that never quite make sense on paper. The businesses that get this right are the ones that treat inventory as a financial asset, not just a storage problem.