Learn how to read a profit and loss statement line by line, with a real restaurant example covering revenue, COGS, gross profit, and net income.
How to Read a Profit and Loss Statement (And What It's Actually Telling You)
A profit and loss statement, also called a P&L or income statement, is the single most important financial document a business owner can review every month. It tells you whether your business is making money, where the money is going, and which parts of your operation are costing you more than they should. If you have never known how to read a profit and loss statement, this guide will change that.
Key Takeaways
- A P&L statement covers a specific time period, typically monthly, quarterly, or annually, and should be reviewed on a consistent schedule.
- Gross profit margin for restaurants averages between 60% and 70%, but net profit margins often fall between 3% and 9%.
- Cost of Goods Sold (COGS) is the single largest controllable expense for most product-based businesses and food service operations.
- Operating expenses include rent, salaries, utilities, and marketing, and they directly reduce the gross profit you worked to earn.
- Net income is what remains after every expense is subtracted from revenue. A positive number means profit. A negative number means the business lost money during that period.
What a P&L Statement Actually Is
The P&L statement is a financial summary that records all revenue earned and all expenses incurred over a defined period. Unlike a balance sheet, which captures a snapshot of assets and liabilities on a single date, the P&L tracks performance over time.
Every line on the statement represents a real business decision. The rent you signed, the food you ordered, the wages you paid. Reading the P&L means reading the consequences of those decisions in numerical form.
For small business owners without an accounting background, this document can feel overwhelming. It does not have to be. The structure is logical, and once you understand the flow from top to bottom, the numbers start to tell a clear story.
The Structure of a P&L: How It Flows
The P&L statement moves in one direction: downward. Each section subtracts from the one above it. Here is the standard order:
- Revenue (also called Sales or Gross Revenue)
- Cost of Goods Sold (COGS)
- Gross Profit
- Operating Expenses
- Operating Income
- Other Income or Expenses
- Net Income
Understanding this flow is the key to reading any P&L correctly. The top line is your total revenue. The bottom line is your actual profit. Everything in between explains the gap.
How to Read a Profit and Loss Statement: A Line-by-Line Breakdown
To make this concrete, we will use a fictional restaurant called Maplewood Kitchen, a 60-seat neighborhood bistro in Columbus, Ohio. The figures below represent a single month of operations.
Line 1: Revenue
Maplewood Kitchen Monthly Revenue: $82,000
Revenue is the total amount of money the business collected from sales before any costs are subtracted. For Maplewood Kitchen, this $82,000 includes dine-in sales, takeout orders, and a small amount from weekend catering events.
Some P&L statements break revenue into subcategories. A restaurant might separate food sales from beverage sales. A retailer might separate online revenue from in-store revenue. This level of detail helps owners spot which revenue streams are growing and which are declining.
The key distinction is that revenue does not mean profit. It is simply the gross amount collected.
Line 2: Cost of Goods Sold (COGS)
Maplewood Kitchen COGS: $26,200
COGS represents the direct cost of producing what the business sells. For a restaurant, this means food and beverage ingredients. For a product-based business, it means raw materials or wholesale inventory.
Maplewood Kitchen spent $26,200 on ingredients that month. That figure covers everything from produce and proteins to cooking oils and condiments. Labor costs for kitchen staff are sometimes included in COGS depending on how the business structures its accounting.
To calculate the COGS percentage, divide COGS by revenue: $26,200 divided by $82,000 equals approximately 32%. Industry benchmarks for restaurants typically target food costs between 28% and 35%, so Maplewood Kitchen is sitting within a healthy range.
Line 3: Gross Profit
Maplewood Kitchen Gross Profit: $55,800
Gross profit is calculated by subtracting COGS from revenue. In this case: $82,000 minus $26,200 equals $55,800.
This number represents what the business has left over after paying for the products it sold, before accounting for overhead. The gross profit margin here is approximately 68%, which is strong for the restaurant industry.
Here is why that matters: if gross profit margin starts shrinking month over month, it usually signals one of two problems. Either revenue is declining, or the cost of ingredients is rising. Both require immediate attention.
Line 4: Operating Expenses
Maplewood Kitchen Total Operating Expenses: $47,100
Operating expenses are the costs of running the business that are not directly tied to producing the product. For Maplewood Kitchen, the breakdown looks like this:
- Rent: $8,500
- Salaries and wages (front of house, management): $22,400
- Utilities: $3,200
- Marketing and advertising: $1,800
- Insurance: $1,400
- Accounting and software: $900
- Supplies and miscellaneous: $900
These expenses total $47,100 for the month. Notice that wages make up nearly half of all operating expenses. That is typical in service businesses, and it is one of the hardest cost categories to reduce without affecting the customer experience.
Operating expenses are sometimes called SG&A, which stands for Selling, General, and Administrative expenses. The terminology varies, but the concept is the same.
Line 5: Operating Income
Maplewood Kitchen Operating Income: $8,700
Operating income is gross profit minus operating expenses: $55,800 minus $47,100 equals $8,700.
This figure is also called EBIT, or Earnings Before Interest and Taxes. It reflects how profitable the core business operations are before factoring in debt payments or tax obligations.
For Maplewood Kitchen, an $8,700 operating income on $82,000 in revenue represents an operating margin of about 10.6%. That sits above the industry average for full-service restaurants, which often hover between 5% and 10%.
Line 6: Other Income and Expenses
Maplewood Kitchen: Interest Expense of $600
This section captures income or costs that fall outside the main business operations. For Maplewood Kitchen, the only item here is $600 in monthly interest on a small business loan used to purchase kitchen equipment.
Other items that might appear in this section include interest earned on a business savings account, gains or losses from selling an asset, or one-time legal fees from a dispute that is unrelated to daily operations.
Line 7: Net Income
Maplewood Kitchen Net Income: $8,100
Net income is the final number. It is calculated by subtracting all remaining expenses from operating income: $8,700 minus $600 equals $8,100.
This is the actual profit the business generated during the month. Out of $82,000 in revenue, Maplewood Kitchen kept $8,100. That is a net profit margin of approximately 9.9%, which is genuinely strong for the restaurant industry.
Net income is the number that answers the fundamental question every business owner has: did we make money this month? In Maplewood Kitchen's case, the answer is yes.
How to Use Your P&L to Make Better Decisions
Reading the statement is only step one. The real value comes from comparing it across time periods and using the numbers to guide decisions.
Compare month over month. If revenue grew by 8% but COGS grew by 14%, something is wrong with food cost control. The P&L will surface that problem immediately.
Compare against industry benchmarks. Maplewood Kitchen's food cost percentage of 32% is acceptable, but a competing restaurant operating at 27% has a structural cost advantage that compounds over time.
Look at the ratio, not just the dollar figure. A business doing $500,000 in monthly revenue with $12,000 in net income has a 2.4% net margin. That is a fragile business. A business doing $80,000 in revenue with $8,000 in net income has a 10% margin and is considerably healthier in relative terms.
Flag any expense category that exceeds its historical average. If utilities spike from $3,200 to $5,100 in a single month, the P&L should trigger a conversation with your operations team or utility provider.
How to Read a Profit and Loss Statement If You Are Starting From Scratch
If you are building your first P&L or reviewing one for the first time, start with three numbers: total revenue, total expenses, and net income. Once you understand those three figures, work backward into the detail.
Most accounting software, including QuickBooks, Wave, and FreshBooks, will generate a P&L automatically if your transactions are categorized correctly. The challenge is not generating the report. The challenge is knowing what to look for when you read it.
Reviewing your P&L monthly, not quarterly or annually, gives you the feedback loop your business needs to course-correct before problems compound.
Save Time With a Ready-to-Use P&L Template
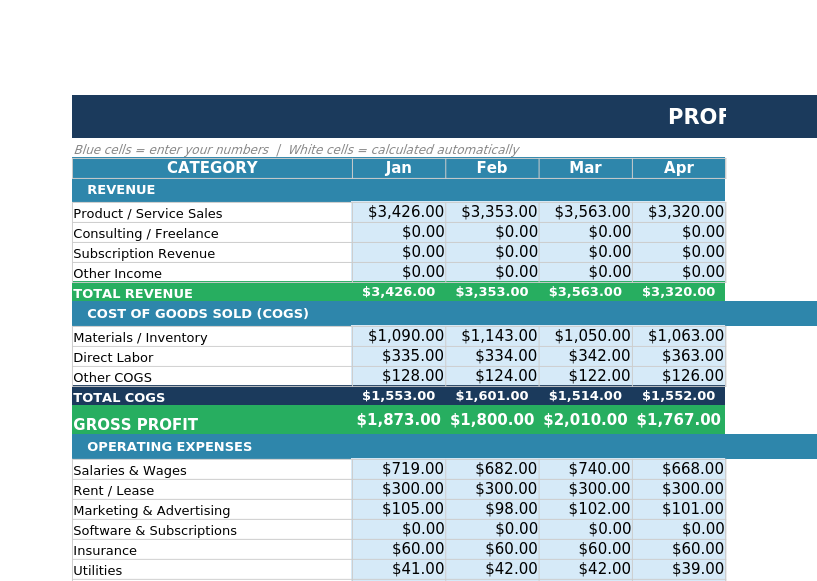
If you want to start tracking your own numbers without building a spreadsheet from scratch, this P&L Statement Template gives you a clean, pre-formatted framework for $15. It includes every line item covered in this post, organized exactly the way an accountant or lender would expect to see it. It is designed for non-accountants who want professional-grade reporting without the setup time.
What the Template Looks Like
Here is a preview of the P&L Statement Template with sample data filled in:
The Bottom Line
A profit and loss statement is not a document reserved for accountants or investors. It is a practical operating tool that every business owner should be able to read and interpret. Understanding the flow from revenue to net income, and knowing what benchmarks to compare your numbers against, puts you in a position to make faster, smarter financial decisions. Maplewood Kitchen's monthly P&L took less than an hour to review and revealed a business operating above its industry average on every key metric.